Trying to decide between Overland Park and Lenexa for your next move in Johnson County? You are not alone. Both cities offer strong value, good commuter access, and a family-friendly lifestyle. In this guide, you will see how the two compare on price, housing types, commute, schools, amenities, taxes, and more so you can match the right city to your priorities. Let’s dive in.
Quick market snapshot
Price points today
Recent city snapshots show similar price bands with some small differences. In January 2026, Overland Park’s median sale price was about $472,500, while Lenexa’s was about $456,850 based on Redfin’s monthly market data for that period. Zillow’s index for Lenexa through December 2025 placed typical values near $462,145. Always remember that these are citywide figures that mask wide variation by neighborhood and ZIP code. Your target subdivision and recent nearby sales will matter more than the city average.
Speed and competition
Market “speed” also differs month to month. In January 2026, Overland Park homes sold faster than Lenexa on median, with days on market around 43 in Overland Park and about 56 in Lenexa. City snapshots also showed Overland Park up year over year on median sale price for that month, while Lenexa’s median trended down year over year. Short-term swings are common, so be sure to check a fresh 12‑month trend and recent comps when you are ready to write an offer.
Housing types and new builds
Overland Park home styles
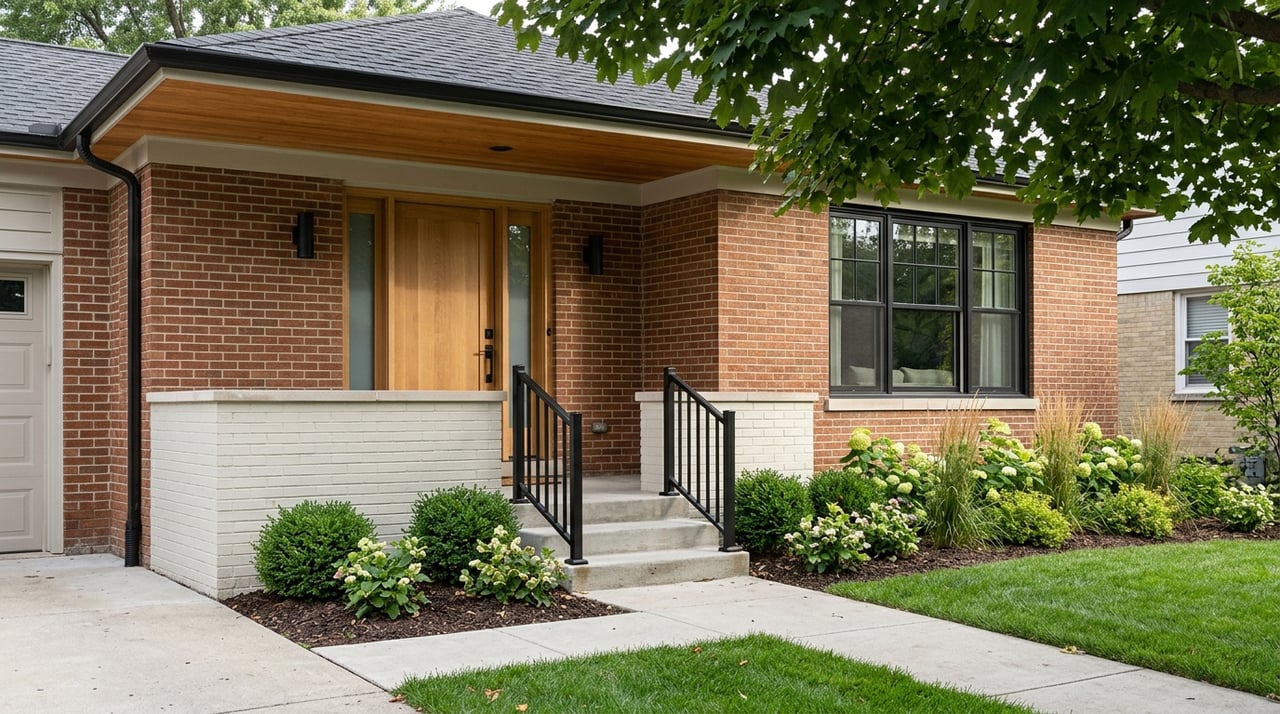
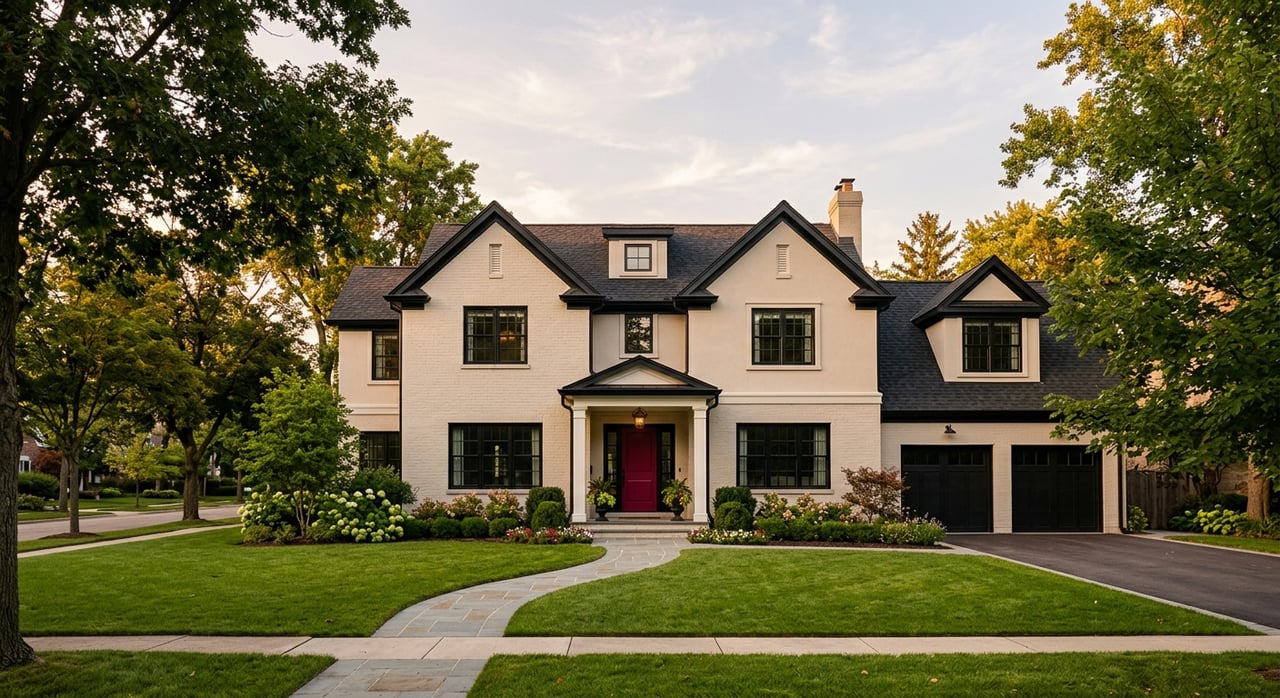
Overland Park offers a wide mix of homes and ages. Many listings reflect a median year built in the mid 1980s. You will find mid‑century ranches and split‑levels in the north, established two‑story homes in central areas, and larger newer builds in southern neighborhoods. The variety makes it easier to shop across price points and lot sizes.
Lenexa home styles
Lenexa’s housing stock includes many ranch and split‑level homes from the 1960s through the 1990s, plus ongoing infill and new subdivisions. If you want mid‑century character or newer construction, you can usually find both here. As in Overland Park, neighborhood and school‑district lines influence price more than the city name alone.
New construction options
Overland Park has explored ways to add more “missing‑middle” options, including a plan to permit pre‑designed Portfolio Homes that aim to broaden attainable housing choices. You can read more about that program in this local summary from Axios on Overland Park’s housing initiative. Lenexa continues to support growth with park investments and capital projects, which helps new neighborhoods take shape over time. If new construction is a must, compare builder offerings and HOA standards in the exact subdivision you like.
Commute and transit
Drive times and highways
Average commute times are similar. Federal estimates for 2019–2023 place Lenexa’s mean travel time near 19.8 minutes and Overland Park near 19.9 to 20.5 minutes. See the Census QuickFacts for Lenexa for context. Major arteries like I‑35, US‑69, and I‑435 provide direct access across Johnson County and into downtown Kansas City. Your exact address and your route will make the biggest difference, so test your commute during peak hours.
Transit options
Public transit is improving, though most residents still drive. Johnson County’s RideKC service expanded to seven days a week, with added fixed routes and microtransit pilots. A direct fixed‑route connection was added between downtown Overland Park and Lenexa City Center as part of those changes. Learn more in this report on Johnson County’s expanded transit service. If you plan to use transit even part time, check park‑and‑ride options near your target neighborhood.
Schools and districts
Overland Park and Lenexa are served by several Johnson County districts. The major ones are Blue Valley USD 229, Shawnee Mission USD 512, Olathe USD 233, and De Soto USD 232. Many campuses across these districts are well regarded in statewide comparisons. District boundaries are address‑specific, so verify attendance before you rely on a reputation or ranking. You can start with the Blue Valley “Find My School” tool and use similar tools for other districts.
Lifestyle and amenities
Overland Park highlights
Overland Park offers a rich mix of cultural and family attractions. The Overland Park Arboretum & Botanical Gardens, Deanna Rose Children’s Farmstead, and the Prairiefire area add nature, entertainment, and museum programming. The Nerman Museum of Contemporary Art on the JCCC campus is another standout. Retail and dining nodes are plentiful across the city, which makes daily errands and nights out easy.
Lenexa highlights
Lenexa emphasizes a compact, modern City Center with civic spaces, dining, and seasonal events. Sar‑Ko‑Par Trails Park and Black Hoof Park offer trails, lakes, and active recreation. The city’s newer recreation center and ongoing parks program add to the appeal. Many buyers choose Lenexa for the parks and a slightly more centralized community feel.
Taxes and ongoing costs
Sales tax
Sales tax rates are similar across Johnson County, but pockets can vary. Lenexa lists a common combined rate near 9.35 percent in general areas, with some Community Improvement Districts adding 1 to 2 percent in specific zones. See the city’s overview of Lenexa sales and property tax for details. Overland Park shows combined rates in a similar range. If you make big purchases, check whether a shopping area carries an extra CID rate.
Property tax by parcel
Total property tax depends on the city, county, school district, and any special assessments. Municipal mill levies differ between Lenexa and Overland Park, and your school district has a major impact. Before you write an offer, ask your lender or agent for an estimate based on the specific address, or review the parcel record through the Johnson County Appraiser. If the home sits in an HOA, add those dues to your monthly budget.
Safety and peace of mind
Multi‑year summaries based on FBI data show both cities with crime rates that are generally at or below national averages. Some summaries report Lenexa with lower property‑crime and violent‑crime rates than Overland Park on a per‑capita basis. You can review city‑level snapshots on CrimeExplorer’s Lenexa page and compare with CrimeExplorer’s Overland Park page. For any purchase, check neighborhood‑level data and speak with local police for block‑level context.
Which city fits your priorities
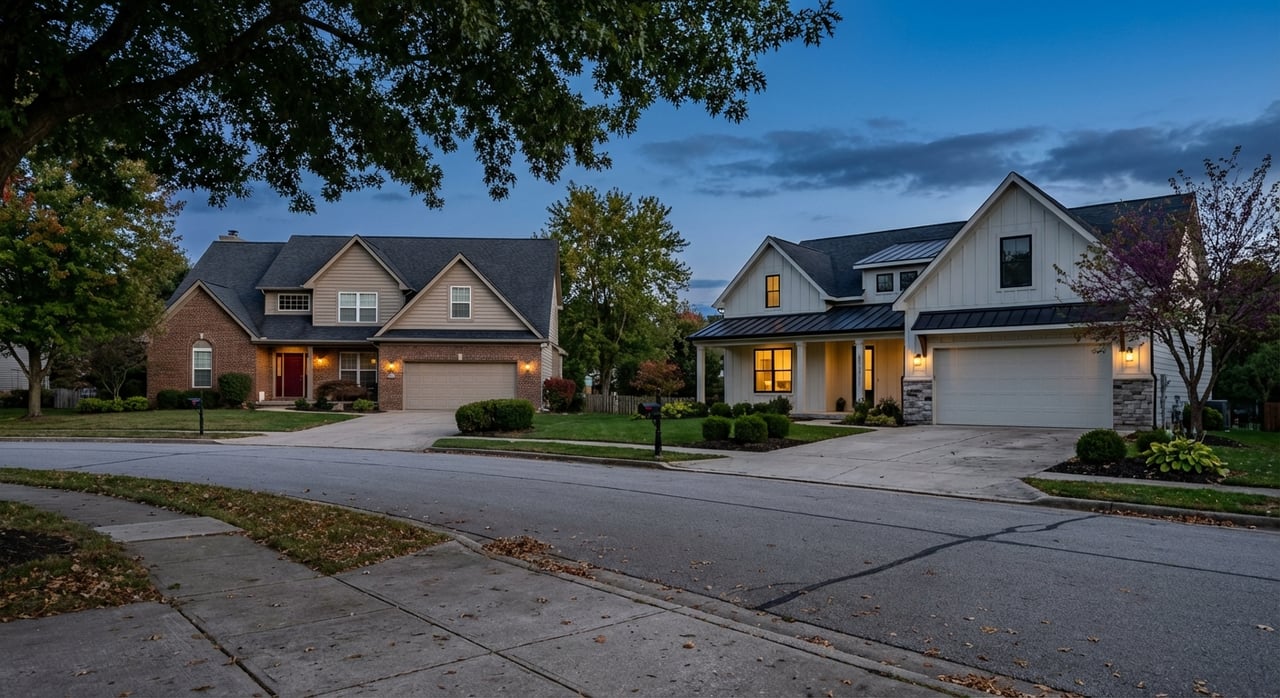
- Choose Overland Park if you want a larger city with a wide selection of cultural attractions, retail, and dining, plus a broad mix of housing from mid‑century bungalows to newer luxury builds. Many buyers target southern areas for access to specific school districts, but there are options at many price points across the city.
- Choose Lenexa if you value parks, trails, and a modern civic core, and you want strong value in established neighborhoods with a good supply of single‑family homes. Newer subdivisions and steady city investments add to long‑term appeal.
Your best fit comes down to your budget, school‑district preferences, commute, and the home style you love. Let recent closed sales and on‑the‑ground neighborhood tours guide your decision.
Buyer checklist
Use this quick list to compare homes and neighborhoods in both cities:
- Verify school attendance by exact address using district tools like the Blue Valley “Find My School” page. Do this before you make school‑based decisions.
- Ask your agent for closed‑sale comps and the latest days‑on‑market trends in the target subdivision. Micro‑markets shift fast.
- Review the parcel’s current property tax bill and mill‑levy breakdown. Confirm HOA fees, rules, and any special assessments.
- Check sales tax details and whether a property or nearby shopping area falls within a CID using Lenexa’s sales and property tax overview. Overland Park has similar area‑specific considerations.
- Test your commute during peak hours and explore park‑and‑ride or bus options. Johnson County’s system expanded service to seven days a week, as noted by KCUR’s coverage.
- Review neighborhood‑level safety information and local police resources. Start with city snapshots on CrimeExplorer for Lenexa and CrimeExplorer for Overland Park.
Ready to compare specific neighborhoods, schools, and commute routes side by side? Our multi‑generational, Overland Park‑based team has guided hundreds of Johnson County buyers through this exact choice. If you want a clear plan, private tours, and data you can trust, reach out to the johns family team for a friendly consult.
FAQs
What are typical home prices in Overland Park vs Lenexa in 2026?
- In January 2026, city snapshots showed Overland Park around $472,500 and Lenexa around $456,850 for median sale price. Values vary widely by ZIP, school district, and home condition.
How do commutes compare for Johnson County buyers?
- Mean commute times are similar, with federal estimates placing Lenexa near 19.8 minutes and Overland Park near 19.9 to 20.5 minutes. See Census QuickFacts for context.
Which school districts serve Overland Park and Lenexa?
- Boundaries cross both cities. Major districts include Blue Valley, Shawnee Mission, Olathe, and De Soto. Always verify by address using tools like Blue Valley’s finder.
Are there extra taxes in some shopping areas?
- Some Community Improvement Districts add 1 to 2 percent to the base sales tax. Lenexa’s page explains ranges and examples on its sales and property tax overview.
How safe are Overland Park and Lenexa for homebuyers?
- Both cities often report crime rates at or below national averages in multi‑year summaries, with Lenexa sometimes lower per capita. Compare city snapshots on CrimeExplorer for Lenexa and Overland Park.